


Published on the 23/09/2015 | Written by Newsdesk
Big data can transform the way businesses operate, but companies have to make sure they comply with rules and regulations around how data is accessed and used…
With requirements for tight information control, graph analytics can help keep track of data handling processes to maintain regulation compliance and best-practices.
That’s according to Alec Gardner Advanced Analytics GM at Teradata, who said, “Regulations and guidelines around how data is accessed and used mean that companies employing big data technology need to have tight information controls in place to handle it properly.”
He said most data management regulations have one thing in common. “They require that the business exerts tight controls over access to the data so that only approved people can access specific resources. By modelling resources and users as a graph, companies can gain visibility and insight into key patterns of permission and usage.”
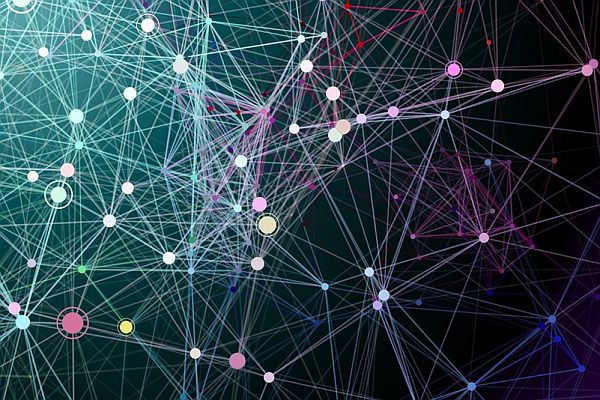
Graph analytics, as the name implies, uses graphs to identify the relationships between datasets. It shows the interconnectedness revealing the most sensitive and mission-critical resources within a company. It then links those resources to employees who can access them, and shows how frequently they use those privileges to keep track of information access and compliance.
Four key ways in which graph analytics can support information compliance are:
- Segregate duties
By segregating duties, organisations can spread out essential functions, and the access to perform them. This reduces the chance of fraud and errors. Companies have to be able to separate authorisation, custody, record keeping, and reconciliation to prevent fraud. By mapping how duties are allocated, companies can make changes if too much power resides in one person. - Identify data that is exposed or sensitive
Companies can pinpoint their most sensitive information and then use graph analytics to see who can access it. This helps to spot areas that are at the most risk of compliance failures. - Monitor ‘super-users’
Every company has ‘super-users’ who have greater access than most other employees. Graph analytics can help keep track of what are these super-users are accessing, and whether they are accessing it from secure or unsecured locations. - Help implement governance rules, policies, and procedures
To ensure compliance, companies have to adopt consistent rules, policies, and procedures that are modelled and implemented from the top down to govern usage. Graph analysis can show how these rules will affect users before implementation, and then help with enforcement once they are adopted.
Gardner said, “Because almost any size of dataset can be expressed as a graph, graph analytics can help make sense of the controls needed across millions of resources, data sources, and users. Graph analytics provides transparency into the access and control of any network, helping maintain information compliance.”